Zlatko Kovačić, retired Associate Professor in Statistics from the Open Polytechnic of New Zealand, will share with us his knowledge and experience on Circular Statistics in Archaeoastronomy Using R.
 In this hands-on session, we will work with real and realistic datasets involving orientations, azimuths, and directions (e.g. sacred buildings, monuments, or traditional practices) and see how circular statistics can help us analyse and interpret such data more appropriately than standard linear methods. The workshop will combine short introductions to key concepts with live demonstrations in R and guided practical exercises.
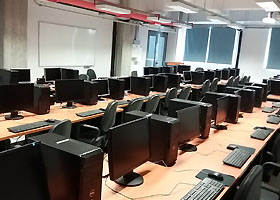
The workshop will take place on the afternoon of Sunday 6 September 2026, in the computer room of the Department of Economics from 16:00 to 20:00. Each participant will have access to a computer with R (and the necessary R packages) already installed, so no prior installation is required on your own laptop. Please, state your interesting in the workshop when registering for the conference.
Who is this workshop for?
The workshop is designed for researchers and students in archaeoastronomy, archaeology, anthropology, history of religion, cultural astronomy, and related fields who:
- work with orientations, azimuths, directions, angles or similar circular data, or
- are considering incorporating such data into their research and would like to understand the statistical tools available.
You do not need to be an expert in statistics or R. Familiarity with basic ideas such as mean, variation, and simple graphs will be helpful, and any previous exposure to R (however modest) will make the workshop more comfortable, but I will explain key steps and provide commented code.
What you will learn
By the end of the workshop, you should:
- understand what makes circular data special and why conventional linear methods can be misleading;
- be able to visualize circular data in R (e.g. circular plots, rose diagrams, circular histograms);
- compute basic circular summary measures (mean direction, dispersion, simple tests for uniformity);
- see at least one example of a simple circular model (e.g. von Mises) interpreted in an archaeoastronomical or ethnoastronomical context;
- have a set of R scripts and example datasets that you can adapt to your own research.
Optional preparation (recommended)
To make the most of the workshop, please consider the following short preparation steps:
- Refresh basic statistical concepts
- Mean, variance/dispersion, histogram, confidence interval (at a very basic level).
- If you have used R before, briefly remind yourself how to:
- run commands in the Console;
- load a CSV file (read.csv() or similar);
- create a simple plot (plot(), ggplot() if you know it).
- Think about your own data
- If you already work with orientations or directions (e.g. azimuths of monuments, churches, megaliths, or ritual features), you are welcome to bring a small sample of your data (for example, as a simple table with a site ID and an azimuth column).
- Time permitting, we may use a few participants’ datasets as informal examples in the final discussion.
Checklist for participants
- I know when and where the workshop will take place (Sunday afternoon, room [ROOM]).
- I understand that the workshop is hands-on and that we will use R on the conference computers.
- I have at least a basic understanding of simple statistical ideas (mean and variability).
- If I have my own orientation data, I have prepared a small, clean table that I could show or use informally.
- I am ready to experiment, ask questions, and think about my own research in terms of circular data.
I look forward to working with you and exploring together how circular statistics can deepen our understanding of cultural and astronomical patterns in material and intangible heritage.
Best regards,
Zlatko Kovačić, PhD